Inteligência Artificial
“The rise of powerful AI will be either the best, or the worst thing, ever to happen to humanity.” — Stephen Hawking
Máquinas inteligentes. Nós as usamos e vemos todos os dias, mas não nos apercebemos o quão futuristas são (como em filmes sci-fi). Claro que não temos robôs a realizar tarefas diárias como no Eu, Robô nem o Will Smith a salvar o mundo (ainda), mas a tecnologia que temos hoje em dia é muito impressionante.
Falar com a Alexa, pedir-lhe que toque a nossa canção favorita, estas são coisas que parecem normais hoje em dia mas há alguns anos pareciam impossíveis. Já que falamos nela, A Alexa é praticamente uma personificação daquilo que entendemos por inteligência artificial. A Alexa consegue realizar funções cognitivas tal como os humanos, como perceber, aprender, raciocinar e resolver problemas. Ou nunca lhe contou uma piada? Ou perguntou qual o sentido da vida?
É esse o objetivo da inteligência artificial: simplificar o esforço humano, ajudar a tomar melhores decisões, e melhorar a maneira como resolvemos problemas. Pode ajudá-lo a completar uma tarefa entediante e repetitiva. Também pode ajudar os cientistas a lidar com informação complexa que é impossível de ser tratada por um ser humano ou que demoraria muito tempo para o fazer.
A inteligência artificial está presente em quase todas as indústrias e áreas hoje em dia. Da mobilidade à saúde, da educação ao retalho, o uso de IA aumentou imenso. De acordo com McKinsey, a IA pode automatizar tarefas de previsão, e coletar/processar dados. Nos Estados Unidos, estas atividades representam 51% de todas as atividades na economia, chegando a 2.7 biliões de dólares em salários.
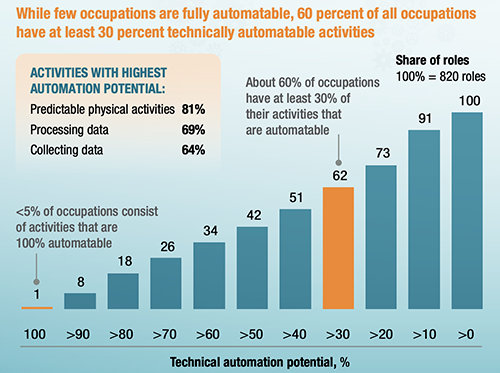
Potencial de automatização de acordo com o McKinsey Global institute (https://www.mckinsey.com)
À medida que os processos são transformados pela automatização de atividades individuais, as pessoas vão começar a realizar atividades que complementam o trabalho que as máquinas fazem, e vice versa.
Se estamos a viver no futuro agora, o que ainda nos espera no futuro? Talvez estejamos mais próximos do Eu, Robô e do Ex Machina do que pensamos.
Visão Computacional
Deteção e Classificação de Objetos
A visão computacional funciona em três passos básicos: adquirir uma imagem, processá-la e entendê-la. Imagens, até em grupos grandes, podem ser entendidas em tempo real através de vídeos, fotos e tecnologia 3D para análise. Depois, modelos de aprendizagem profunda automatizam, mas os modelos são muitas vezes treinados ao primeiramente serem inundados com milhares de imagens pré-identificadas. O último passo é o interpretativo, em que um objeto é identificado ou classificado.
Deteção Facial
O seu objetivo é encontrar caras em fotos, reconhecê-las quase instantaneamente e depois realizar a ação que lhe é pedida, como por exemplo permitir acesso a um utilizador aprovado. Começa por aprender um grupo de características simples de cada face, que em conjunto tornam a classificação mais fácil. Depois, os modelos são organizados numa hierarquia de crescente complexidade.
Reconhecimento Facial
Existem duas abordagens de reconhecimento facial que permitem a sua utilização: métodos beaseados em características que utilizam filtros pré-definidos para encontrar e detetar caras, e métodos baseados em imagens que aprendem holisticamente como extrair caras de uma imagem inteira.
Deteção de Movimento
Para ser realizado, segue alguns passos: O primeiro é a segmentação do vídeo em frames, duas imagens (A & B) que são tiradas de seguida e convertidas em nível de cinza. Os próximos passos são a identificação de diferenças entre estas imagens em nível de cinza e, se for detetada uma diferença significativa entre estas imagens A & B, pode-se concluir que ocorreu algum movimento.
Rede Neural Convolucional
A rede neural convolucional é uma das principais componentes das aplicações de visão computacional. Ela é excelente na captura de padrões em espaços multidimensionais. Qualquer rede neural convolucional é composta por uma ou mais camadas convolucionais, que contêm vários filtros. Cada filtro tem valores diferentes e extrai características diferentes da imagem carregada. Ao entrar mais profundamente na rede, as camadas detetam objetos mais complexos como carros, árvores ou pessoas.
Aprendizagem Profunda
A aprendizagem profunda é um subconjunto de machine learning baseado em redes neurais artificiais. O processo de aprendizagem é profundo porque a estrutura de redes neurais artificiais consiste em consiste em múltiplas camadas de entrada, saída e camadas ocultas. Cada camada contém unidades que transformam dados de entrada em informação que a seguinte camada pode usar para uma tarefa de previsão. Graças a esta estrutura, uma máquina pode aprender através do seu processamento de dados.
Kernel
Baseado no conceito fundamental da definição de similaridades entre objetos, o método Kernel permite a previsão de propriedades de novos objetos baseado em propriedades de objetos já conhecidos ou na identificação de subespaços ou subgrupos comuns em coletas de dados que de outra forma seriam pouco estruturadas.
Pooling
A maior parte das redes neurais convolucionais utiliza camadas de pooling para manter as partes mais importantes e reduzir gradualmente o tamanho dos dados. Para além disso, as camadas de pooling permitem às redes neurais convolucionais generalizar as suas capacidades e ser menos sensíveis ao deslocamento de objetos em imagens.
Padding
O Padding extende a área em que uma rede neural convolucional processa uma imagem. Adicionar padding a uma imagem processada por uma rede neural convolucional permite uma análise mais precisa das imagens.
Processamento de Linguagem Natural
Reconhecimento de Fala
A Siri da Apple, a Alexa da Amazon e chatbots são exemplos reais de este tipo de aplicação. Elas utilizam reconhecimento de fala ou de texto para reconhecer padrões em comandos de voz e linguagem natural para responder de forma apropriada com comentários úteis.
Análise de Sentimentos
Em negócios, a análise de sentimentos revela insights de dados ocultos provenientes de canais de social media. A análise de sentimentos identifica emoções em textos e classifica opiniões como positivas, negativas ou neutras acerca de produtos, promoções e informação sobre eventos. Por exemplo, poderia analisar em tempo real tweets que mencionam a sua marca e detetar de forma imediata comentários de consumidores zangados.
Deteção de Língua
Consegue detetar a língua, o que é uma solução para muitas aplicações IA e linguistas computacionais. É muito usada em dispositivos electrónicos como telemóveis, computadores, e também em robôs. Para além disso, a deteção de língua ajuda a identificar documentos com várias línguas.
Transcrição (speech-to-text)
O objetivo deste sistema é extrair, caracterizar e reconhecer informação sobre a fala. Também conhecido como STT, recebe os dados de áudio and e depois tenta identificar padrões e chegar a uma conclusão em texto. Um dos aspectos positivos seria as taxas de precisão superiores a 96% e consultas de pesquisa típicas com uma latência de apenas 50 milissegundos.
Tradução
Quando traduz uma frase no Google Translate, está a usar o processamento de linguagem natural. A tradução entre línguas é mais complexa do que uma simples tradução literal palavra a palavra. Ela requere gramática e contexto para que se possa entender perfeitamente uma frase. O processamento de linguagem natural aborda isso ao processar o texto na sequência de entrada e mapeá-lo com a linguagem para traduzi-lo instantaneamente.
Síntese de Fala (Text-to-Speech)
O sistema Text To Speech (TTS) tem como objetivo converter a linguagem natural em fala. Tem tido um grande desenvolvimento nos últimos anos. O Google Assistant e a Cortana da Microsoft são dispositivos smart que exemplificam uma forma de TTS. Outra forma de TTS é a automatização de conteúdo áudio em notícias.
Classificação de Texto
Um outro exemplo seria a classificação de texto, que ajuda a organizar texto não estruturado em categorias e automatiza o processo de etiquetagem de solicitações de suporte recebidos e roteamento automático para a pessoa certa. Para empresas, é uma ótima maneira de obter insights em relação ao feedback dos clientes.
Ambiguidade
Ambiguidade, por definição, é texto que pode ter múltiplas interpretações alternativas. Em sistemas IA, existem diferentes formas relevantes de fazer processamento de linguagem natural, como lexical, sintática e semântica. to NLP such as Lexical, Syntactic and Semantic. Metonímia e metáfora são outros exemplos. Ao processo de lidar com a ambiguidade dá-se o nome de desambiguação.
Sinonímia
Pode-se resolver como um problema em dois passos: geração de candidatos e deteção de sinónimos. No primeiro, dado uma palavra, serão gerados todos os possíveis candidatos que poderiam ser sinónimos para a palavra. O segundo passo pode ser resolvido como um problema clássico de aprendizagem supervisionada.
Tokenização
É uma tarefa comum no processamento de linguagem natural. É o processo em que se parte um texto em pequenas unidades chamadas tokens. Um token pode ser uma palavra, parte de uma palavra ou apenas caracteres como acontece com a pontuação. Por isso, a tokenização pode ser classificada em 3 tipos – palavra, caracter, e subpalavra (caracteres n-grama).
Bag of words
Uma bag of words (saco de palavras), é a forma mais simples de representação textual em números. Chama-se assim porque qualquer informação sobre a ordem ou estrutura das palavras no documento é descartada. Este modelo só se preocupa em ver se palavras conhecidas estão no documento, e não em ver onde estão.
Embedding
As abordagens de machine learning para o processamento de linguagem natural exigem que as palavras sejam expressas na forma de vetores, frequentemente com dezenas ou centenas de dimensões. Isto contrasta com as milhares ou milhões de dimensões necessárias para representações de palavras dispersas. Em muitos casos, a representação vetorial de entidades complexas além das palavras é necessária para determinadas tarefas, como vetores para Frase, Parágrafo e Documentos.
Machine Learning

O Machine Learning é uma área que desenvolve algoritmos baseados em dados para melhorar e/ou automatizar o processo de tomada de decisão. É visto como parte da Inteligência Artificial (IA), mas as aplicações de Machine Learning são usadas em diversas situações que não podem ser consideradas IA, mas sim tarefas de previsão mais simples.
No entanto, atualmente o Machine Learning está muito relacionado à IA, e dá aos dispositivos a capacidade de melhorar com a experiência sem serem explicitamente programados (a que se chama Aprendizagem por Reforço).
Por exemplo, quando está a conduzir e a usar uma app de navegação para encontrar o caminho mais rápido. Ou quando usa um software ou app para converter a sua voz num ficheiro de texto. Nestes exemplos vemos que o Machine Learning está presente e faz parte da nossa vida quotidiana.
O Machine Learning é essencialmente uma questão de previsão. A máquina só consegue prever resultados a partir de dados que recebe. Vamos olhar para os exemplos acima. A app de navegação consegue dizer-lhe o melhor caminho porque coleta dados de outros utilizadores que utilizam o mesmo tipo de aplicações. Os dados (velocidade média, rota escolhida, localização) combinados com um algoritmo, fazem com que a previsão seja possível.
O Machine learning juntamente com a visão computacional conseguiu melhorar várias áreas. Conseguiu ajudar a diagnosticar doenças ou a analisar milhares de transações financeiras por segundo à procura de fraude. No geral, o Machine Learning pode ajudar em áreas de pesquisa muito específicas ou em tarefas impossíveis para seres humanos, devido ao seu volume ou complexidade.
Pode ser usado com várias abordagens:
Aprendizagem Supervisionada
É a execução de modelos de Machine Learning onde tanto a entrada quanto a saída são conhecidas e usadas para fins de previsão e comparação. O Cientista de Dados prepara e configura o modelo num processo dinâmico e iterativo até obter a melhor e mais precisa previsão, considerando a saída esperada.
Esta abordagem é muito útil para previsões. (Regressões e classificações)
Aprendizagem não Supervisionada
Neste caso, a saída é desconhecida, então o modelo é treinado sem um valor esperado para comparação, mas, em vez disso, tenta obter insights e correlações entre os dados.
Isto é útil em casos onde o especialista humano não sabe o que procurar nos dados, sendo usado na deteção de padrões e modelagem descritiva, mas no processo típico de Machine Learning é utilizado para agrupamento e redução de características.
Aprendizagem Semi-supervisionada
Explora a ideia de que mesmo que os grupos de dados não rotulados sejam desconhecidos, estes dados contêm informação importante sobre os parâmetros de grupo.
Classificação
É utilizada quando se precisa de um conjunto limitado de resultados e geralmente fornece valores de saída previstos. Funciona como Binomial com saída de 2 categorias (como Verdadeiro ou Falso) ou como Multi-Classe, onde pode prever várias categorias (como tipos de carros).
Um exemplo seria determinar se um email recebido é spam ou não.
Regressão
Esta tarefa pode ajudar-nos a prever o valor do rótulo através de um grupo de características relacionadas. Por exemplo, pode prever preços de casas baseado nos seus atributos como o número de quartos, a localização ou o tamanho.
Agrupamento
Agrupamentos podem organizar conjuntos de dados baseados nas suas características. Esta técnica de aprendizagem não supervisionada não tem qualquer informação de saída para o processo de treino. Um exemplo seria entender segmentos de hóspedes de hotéis com base nos seus hábitos e características das suas escolhas de hotel.
Redes Neurais
Algoritmo de aprendizagem de rede neural artificial, ou rede neural, ou simplesmente neural. Muitos sinónimos, mas um único significado: ele usa uma rede de funções para entender e traduzir uma entrada de dados de uma forma para uma saída desejada, geralmente noutra forma.
Em geral, não precisa de ser programado com regras específicas que definam o que esperar da entrada. Em vez disso, o algoritmo aprende com a experiência. Quanto mais exemplos e variedade de entradas disponíveis, mais precisos os resultados geralmente se tornam.
Devido a essa característica, não há limite para as áreas em que essa técnica pode ser aplicada. Algumas delas são previsão de trajetória de veículos autónomos, pesquisa sobre cancro, deteção de objetos, etc.
Árvores de Decisão
Uma árvore de decisão pode ser usada para representar visual e explicitamente decisões e tomadas de decisão, ou criar um modelo que prevê o valor de uma variável alvo. Como o nome sugere, ela usa um modelo em forma de árvore de decisões, na qual o nó da folha corresponde a um rótulo de classe e os atributos são representados nos nós internos da árvore. Pertencente à família de aprendizagem supervisionada, este algoritmo é geralmente referido como CART ou Árvores de Classificação e Regressão. Simples de entender, interpretar, visualizar são apenas algumas vantagens; elas também podem implicitamente realizar uma triagem de variáveis ou seleção de características e lidar tanto com dados numéricos quanto categóricos. Por outro lado, aprendizes de árvore de decisão podem criar árvores excessivamente complexas que não generalizam bem os dados. Além disso, podem ser instáveis, pois pequenas variações nos dados podem resultar numa árvore completamente diferente a ser gerada, ao que se chama uma variância.
Introdução
Embora permita ter mais tempo para testar e otimizar modelos para criar mais valor, uma boa preparação de dados demora mais tempo do que qualquer outra parte do processo. O passo anterior à preparação de dados envolve a definição do problema. Quando isto é decidido, existem seis passos importantes a seguir: Coleta de dados, exploração e perfilamento, formatação, melhoria da qualidade dos dados, engenharia de características e separação de dados em grupos de treino e avaliação. Isto inclui ter a certeza de que os dados são formatados da maneira mais apropriada ao modelo de Machine Learning; definir uma estratégia para lidar com dados erróneos, valores ausentes e valores discrepantes; transformar os dados de entrada em novas características que representem melhor o negócio ou reduzam a complexidade; e finalmente dividir os dados de entrada em 3 conjuntos de dados: um para treinar o algoritmo, outro para fins de avaliação e o terceiro para fins de teste.
Normalização
Estandardização
Hiperparâmetros
O Tuning consiste em maximizar a performance de um modelo sem sobreajustar ou criar uma variância demasiado elevada ao selecionar "hiperparâmetros" apropriados. Eles devem ser definidos manualmente, ao contrário de outros modelos de parâmetro que podem aprender através de métodos de treino. Muitos tipos de hiperparâmetros estão disponíveis e alguns dependem da técnica usada. Por agora só vamos reter o conceito de que um hiperparâmetro é um valor de configuração que controla os processos de treino e avaliação.
Nota: Brevemente iremos atualizar a nossa biblioteca com vários hiperparâmetros e técnicas.
Validação Cruzada
Fácil de entender e fácil de implementar. É uma técnica para avaliar e testar um modelo de Machine Learning. A validação cruzada consiste na comparação de resultados de modelos com resultados reais para avaliar a precisão e qualidade do modelo. É usada na abordagem de aprendizagem supervisionada para previsões categorizadas.
Existem muitos modelos de validação cruzada, como K-Fold, Leave-P-Out, mas o mais simples e comum é o Hold-out.
Nota: Brevemente iremos atualizar a nossa biblioteca com explicações destes tipos distintos.
Erro Quadrático Médio
Falando em falta de precisão, o erro quadrático médio é capaz de identificar um erro rapidamente. Sendo um tipo específico de perda de função, eles são calculados pela média dos erros que foram elevados ao quadrado dos dados.
Portanto, a sua utilidade vem do facto de que números elevados ao quadrado são positivos, e que os erros são elevados ao quadrado antes de ser calculada a média. Além disso, o erro quadrático médio é frequentemente usado como uma medida para obter uma imagem melhor da variância e da tendência nos conjuntos de dados.
Sobreajustes
De qualquer das formas, a validação cruzada é muito útil em avaliar o quão eficiente é um modelo, particularmente em casos em que tem de mitigar sobreajustes. Os sobreajustes são um conceito de ciência de dados que ocorre quando um modelo estatístico se ajusta exatamente aos seus dados de treino - há uma taxa de erro pequena e os dados de teste têm uma taxa de erro elevada. Uma das maneiras de o evitar seria o aumento de dados. Embora seja melhor injetar dados limpos e relevantes, às vezes dados ruidosos são adicionados para tornar um modelo mais estável. No entanto, esse método deve ser usado com moderação.
Data Warehouse
Data Warehouse é um tipo de sistema de gestão de dados que é usado como entidade principal para sistemas de business inteligence. Este sistema contém uma enorme quantidade de dados e a sua função é realizar consultas e análises de grande importância. Para o design temos duas abordagens que são o modelo Kimball e o modelo Inmon, que são descritos da seguinte forma:
Kimball:
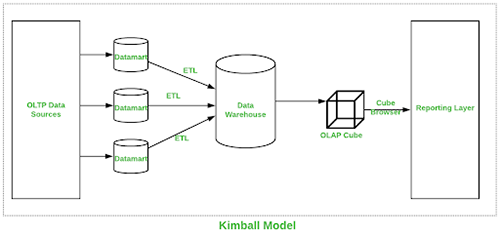
Esta abordagem foi introduzida por Ralph Kimball. Aqui, o processo para desenvolver uma data warehouse começa em perceber processos de negócio e consultas a que o sistema data warehouse tem de responder. Para Kimball, a maior preocupação é o desempenho em execução de consultas em vez do espaço no disco, então ele usa uma forma de denormalização para a modelagem de dados.
O procedimento Extract Transform Load (ETL) junta dados de ume variedade de fontes e agrupa-as numa área comum chamada staging que é depois transformada num cubo OLAP (Vários tipos de OLAP podem ser usados).
Estes são os benefícios deste processo:
- • Setup rápido.
- • Geração bem-sucedida de relatórios em múltiplos esquemas estrela.
- • Operação eficaz.
- • Fácil utilização e funcional com menos espaço.
- • Desempenho mais rápido.
- • Uniformização.
Representação visual da Kimball Data Warehouse abaixo:
Inmon:
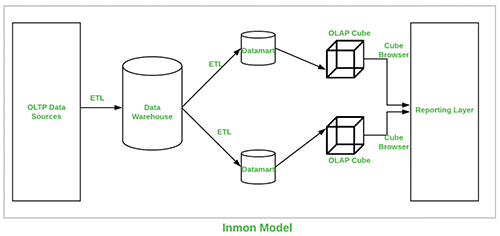
Esta abordagem foi introduzida por Bill Inmon e começa com um modelo de dados corporativo que identifica áreas críticas enquanto mantém a prioridade no cliente, produto e vendedor. Esta abordagem tem sucesso no desenvolvimento de modelos utilizados para operações de grande importância que depois são usados para desenvolver um modelo físico. O lado positivo desta abordagem é que ela é normalizada e evita redundância de dados, mas a sua estrutura complexa faz com que seja difícil de utilizar em objetivos de negócio para os quais são criados data marts, e cada secção de departamento é capaz de a utilizar para os seus objetivos.
Estes são os benefícios deste processo:
- • Aberto a mudanças.
- • Fácil de entender.
- • Reduz o espaço no disco.
- • Relatórios podem ser usados por toda a empresa.
- • Processo ETL menos suscetível a erros..
Representação visual da Inmon Data Warehouse abaixo::
Esquema estrela:
No que toca a data warehouse, dentro deste conceito temos uma tabela de factos central e várias tabelas associadas a essa tabela de factos. Este tipo de organização parece uma estrela, daí a sua terminologia. Esta é a forma esquemática mais simples de data warehouse e serve principalmente para a consulta de quantidades enormes de dados.
Constelações:
Vai além do esquema estrela, porque aqui temos duas tabelas de factos em vez de uma, e estas tabelas de factos têm várias tabelas associadas de forma a que a sua organização parece uma constelação ou grupo de estrelas, e é por esse motivo que se chama um esquema constelação. Aqui, as dimensões partilhadas são denominadas dimensões conformes. O conceito de dimensões conformes será explicado no próximo ponto.
Dimensões conformes:
Por dimensões conformes queremos dizer aquelas dimensões que são desenvolvidas de uma forma em que podem ser utilizadas em várias tabelas de factos e muitas áreas temáticas de data warehouse. Dimensões conformes ajudam na consistência de relatórios em várias áreas temáticas, o que baixa os custos de desenvolvimento dessas áreas ao reutilizar as dimensões existentes. O melhor exemplo de dimensões conformadas é dimensão de dados visto que a maior parte das warehouses tem uma única dimensão de dados que pode ser usada por toda a warehouse.
Dimensões:
Na área de data warehouse, o termo dimensão significa um grupo de informações de referência acerca de um evento mensurável que são conhecidas como factos. Estas dimensões classificam e explicam factos de data warehouse e analisam-nos de forma significativa para que respondam a consultas de negócios. As dimensiões podem ser referidas como o centro da modelagem dimensional.
Tabelas de factos:
As tabelas de factos são as entidades centrais num esquema estrela de uma data warehouse. Uma tabela de factos é usada para guardar informação quantitativa para variadas formas de inspeção e geralmente é desnormalizada. Uma tabela de factos é funcional com tabelas de dimensão e guarda os dados a serem examinados, enquanto que uma tabela de dimensão guarda dados sobre os métodos em que a informação pode ser examinada e analisada.
Data management:
Um procedimento que inclui ingestão, armazenamento, montagem e preservação do valioso conjunto de dados que é tanto coletado como gerado por uma organização. Data management tem um papel importante na instalação de sistemas IT que ajudam uma organização nos seus processos de tomada de decisões e planeamento estatégico por parte dos seus managers e consumidores.
Data management eficiente está dependente dos seguintes fatores:
Data quality:
Aqui, calculamos o estado de vários fatores como a exatidão dos factos, a sua integridade e se é gerada consistentemente ou não. Estes fatores têm um papel importante para decidir a qualidade dos dados que podem ser então usados para executar várias aplicações.
Data profiling:
O segundo fator importante é a revisão da fonte de onde os dados são gerados, conhecimento da sua estrutura, do seu conteúdo, das suas relações com outras fontes de dados e o entendimento de como estes dados nos podem ajudar nos nossos projetos. Esta análise ajuda-nos a poupar tempo na identificação de problemas e desenvolvimento de soluções.